Ecological footprint of the richest: United States country profile
Introduction
 This country profile is part of the research on the inequality of overconsumption which attempts to quantify the full ecological footprint of the richest people in different countries around the world. Read a summary of the working paper published by the Global Sustainability Institute, Anglia Ruskin University (read the full working paper).
As there is no data or research available on the ecological footprint of the richest the focus here is on High Net Worth Individuals in the countries where they are concentrated: the United States, Japan, China, United Kingdom and France.
Identifying the richest people in the United States
Total population: 321 million in 2015 (Source: CIA World Factbook, July 2015 estimate)
This research uses the number of High Net Worth Individuals to identify the richest people in the United States. HNWI’s are defined as “having a minimum of US$1 million in investable wealth, excluding primary residence, collectibles, consumables, and consumer durables”. In 2014 there were 4.3 million HNWI’s in the United States (Source: Capgemini and RBC Wealth Management)
Inequality indicators
Income inequality: Share of income captured by the richest 1% in 2012 was 18.8% (Source: The World Top Incomes Database)
Wealth inequality: Share of wealth captured by the richest 1% in 2010 was 36.6% (Source: OECD Wealth Distribution Database)
Ecological footprint indicators
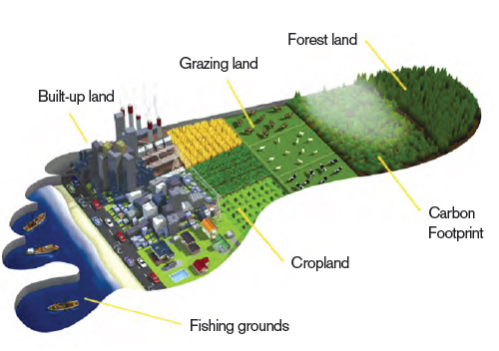
(Credit:Global Footprint Network)
This research uses the ecological footprint as a reference point to discuss the overconsumption by the richest people. The Global Footprint Network methodology explains that the “ecological footprint of a person is calculated by considering all of the biological materials consumed and all of the carbon dioxide emissions generated by that person in a given year.” This includes a person’s consumption of products from fisheries, cropland, grazing land, forests (wood and capture of carbon dioxide), and also use of urban land (Source: Global Footprint Network).
Lack of data on the richest people
There is currently no data available to accurately quantify the different components of the ecological footprint of the richest people in the United States e.g. their total carbon footprint. The closest information available relates to the richest 10% and is based on household expenditure surveys (see methodology for discussion of strengths and weakness of using this metric).
There is a focus on fuels for private transport and meat as two key indicators as well as looking at total expenditure. Private transport and food have been identified as the main sources of individuals’ environmental impact in developed countries (Peattie and Peattie, 2009). These two indicators represent examples of direct (fuel used in private vehicles) and indirect (meat) greenhouse gas emissions. It is important to cover both types of indicator because there are numerous studies that show the majority of emissions in developed countries are often indirect, for example from food, consumer electronics, clothing and recreation (Capstick et al., 2015; Büchs and Schnepf, 2013; Druckman and Jackson, 2008).
| United States: Household annual expenditure in 2014 | Total all deciles | Richest 10% | Poorest 10% | ||
|
Total expenditure
|
US$564,912 |
US$172,669 (23% of total) |
US$5,348 (4% of total) |
||
|
Fuel for private transport (Gasoline and motor oil) |
US$25,707 |
US$4,1721 (16% of total) |
US$1,142 (4% of total) |
||
|
Meat consumption (Beef, pork, poultry and other meats) |
US$8,252 |
US$1,320 (16% of total) |
US$546 (7% of total) |
||
Source: Household expenditure survey July 2013 to June 2014, US Bureau of Labor Statistics (2015)
Complementary data
The US Energy Information Administration released data in April 2015 showing that the richest spent more on petrol than other income groups between 2003-2013: “travel-related expenditures tend to vary directly with household income levels. The highest income quintile (making at least $95,000 per year) spent slightly more than $4,000 on gasoline in 2013, while the lowest income quintile (making under $18,000 per year) spent about $1,200 on gasoline.
————————————————————————
Submit data on the ecological footprint of the richest people in the United States
The data you submit can either be in any format e.g. statistics, visuals, symbolic examples. If the data you want to submit does not fit with the categories below contact us.
Leave a Reply