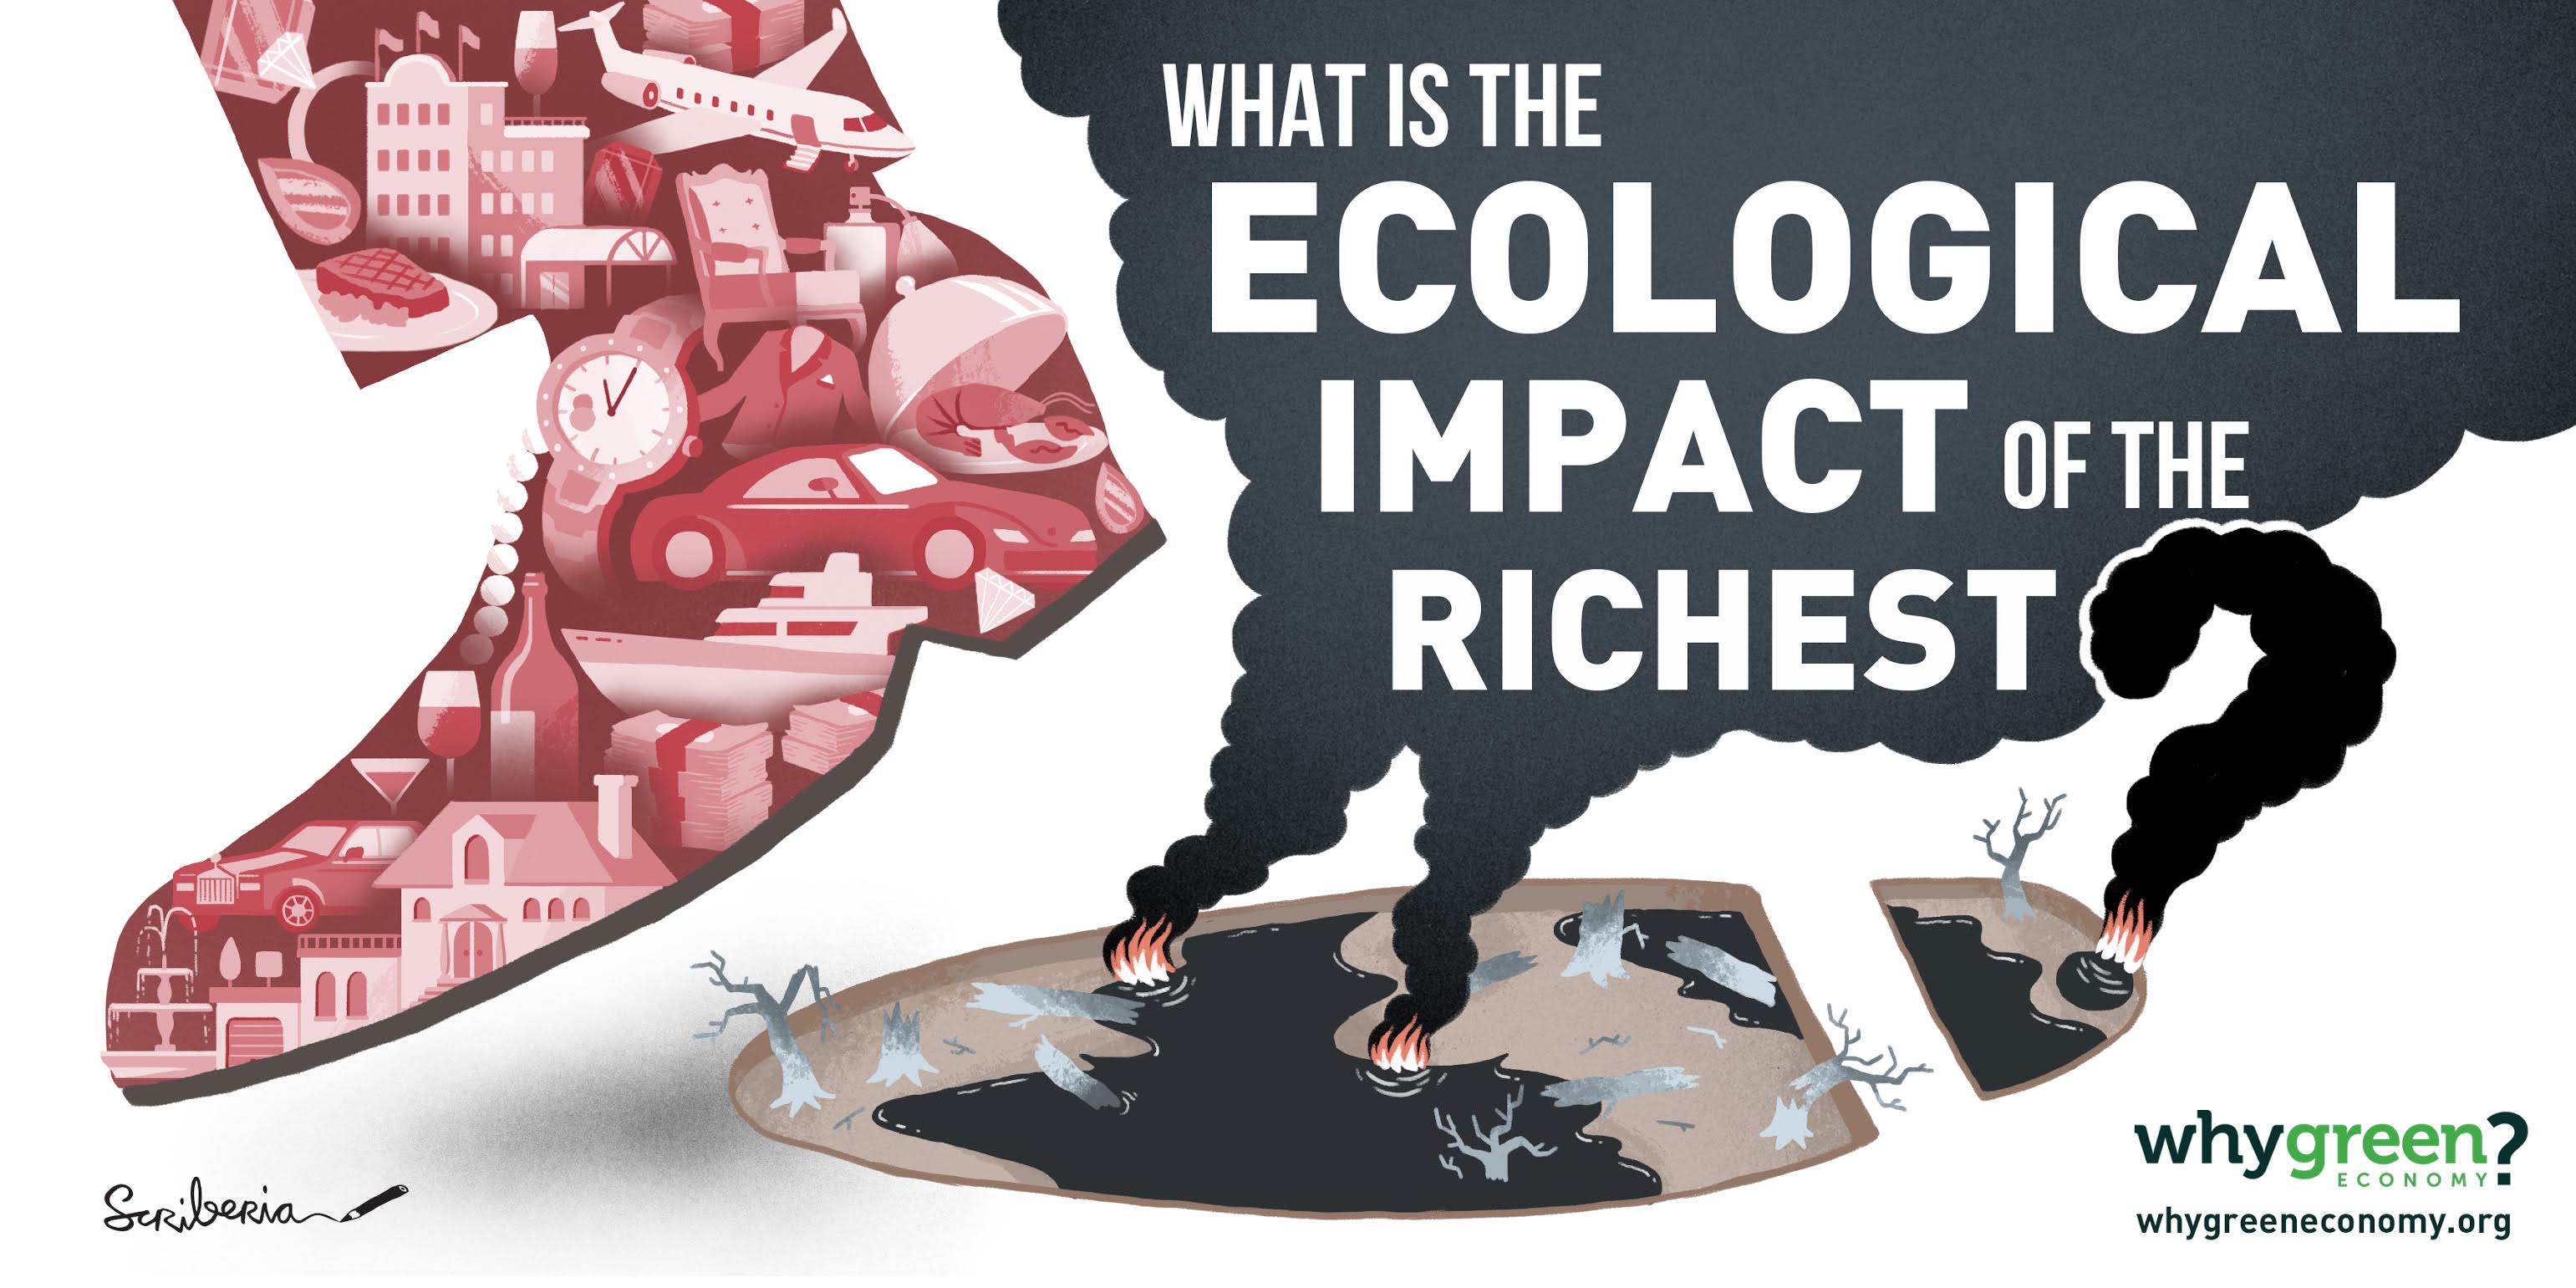
Ecological footprint of the richest
 Introduction
The working paper The inequality of overconsumption: the ecological footprint of the richest (published in November 2015 by Anglia Ruskin University / read the full working paper) includes an exercise that attempts to quantify the ecological footprint of the richest. As there is no data or research available on the ecological footprint of the richest the focus here is on High Net Worth Individuals (HNWIs) in the countries where they are concentrated: the United States, Japan, China, United Kingdom and France.
HNWIs are people with ‘a minimum of US$1 million in investable wealth, excluding primary residence, collectibles, consumables, and consumer durables’. According to the latest World Wealth Report in 2014, there were around 14.6 million HNWIs defined as ‘having a minimum of US$1 million in investable wealth, excluding primary residence, collectibles, consumables, and consumer durables’. The majority of HNWIs lived in the US (4.3 million), Japan (2.4 million), Germany (1.1 million), China (890,000), UK (550,000) and France (494,000). Together these make up nearly 10 million people.
Methodology
This research uses the ecological footprint as a reference point to discuss the overconsumption by the richest people in society. The Global Footprint Network methodology explains that the “ecological footprint of a person is calculated by considering all of the biological materials consumed and all of the carbon dioxide emissions generated by that person in a given year.” (Global Footprint Network, 2015).
To try to get an indication of the size of the ecological footprint of the richest this exercise uses household expenditure surveys because of their relative ease in identifying the consumption patterns of different income groups. While this is not ideal, because it means broadening the scope to the richest 10% of the population (by income) instead of just HNWIs, it is a starting point. There is a focus on two indicators that represent examples of direct (fuel used in private vehicles) and indirect (meat) greenhouse gas emissions.
Country profiles

4.3 million High Net Worth Individuals in 2014.
The richest 10% accounted for 23% of total expenditure, 16% of expenditure for private transport, and 16% of expenditure for meat.
2.4 million High Net Worth Individuals in 2014.
The richest 10% accounted for 18% of total expenditure, 20% of expenditure for private transport, and 16% of expenditure for meat.

1.1 million High Net Worth Individuals in 2014.
The richest 20% accounted for 34% of total expenditure.
890,000 High Net Worth Individuals in 2014.
The richest 10% spent an estimated 14 times more than the poorest 10%.

550,000 High Net Worth Individuals in 2014.
The richest 10% accounted for 21% of total expenditure, 20% of expenditure for private transport, and 15% of expenditure for meat.
494,000 High Net Worth Individuals in 2014.
The richest 10% accounted for 17% of total expenditure, 13% of expenditure for private transport, and 13% of expenditure for meat.
Additional country profiles
198,000 High Net Worth Individuals in 2014.
The richest 10% accounted for 31% of total expenditure, 47% of expenditure for private transport, and 19% of expenditure for meat.
No information about the number of HNWIs in Malawi
The richest 20% accounted for 51% of total expenditure, and 55% of expenditure for meat.
Leave a Reply