Ecological footprint of the richest: India country profile
Introduction
 This country profile is part of the research on the inequality of overconsumption which attempts to quantify the full ecological footprint of the richest people in different countries around the world. Read a summary of the working paper published by the Global Sustainability Institute, Anglia Ruskin University (read the full working paper).
As there is no data or research available on the ecological footprint of the richest the focus here is on High Net Worth Individuals.
Identifying the richest in India
Total population: 1.2 billion in 2015 (Source: CIA World Factbook, July 2015 estimate)
This research uses the number of High Net Worth Individuals to identify the richest people in India. HNWI’s are defined as “having a minimum of US$1 million in investable wealth, excluding primary residence, collectibles, consumables, and consumer durables”. In 2014 there were 198,000 HNWI’s in India (Source: Capgemini and RBC Wealth Management)
Inequality indicators
Income inequality: Share of income captured by the richest 10% in 2011 was 30% (Source: World Bank)
Ecological footprint indicators
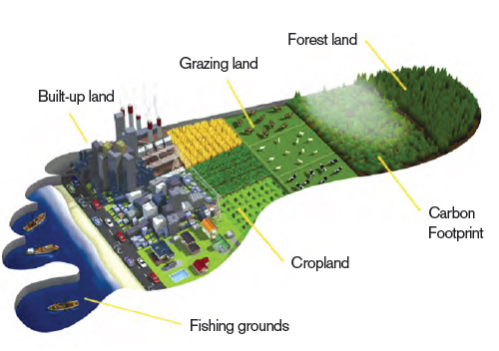
(Credit:Global Footprint Network)
This research uses the ecological footprint as a reference point to discuss the overconsumption by the richest people. The Global Footprint Network methodology explains that the “ecological footprint of a person is calculated by considering all of the biological materials consumed and all of the carbon dioxide emissions generated by that person in a given year.” This includes a person’s consumption of products from fisheries, cropland, grazing land, forests (wood and capture of carbon dioxide), and also use of urban land (Source: Global Footprint Network).
Lack of data on the richest
There is currently no data available to accurately quantify the different components of the ecological footprint of the richest people in India e.g. their total carbon footprint. The closest information available relates to the richest 10% and is based on household expenditure surveys (see methodology for discussion of strengths and weakness of using this metric).
There is a focus on fuels for private transport and meat as two key indicators as well as looking at total expenditure. Private transport and food have been identified as the main sources of individuals’ environmental impact in developed countries (Peattie and Peattie, 2009). These two indicators represent examples of direct (fuel used in private vehicles) and indirect (meat) greenhouse gas emissions. It is important to cover both types of indicator because there are numerous studies that show the majority of emissions in developed countries are often indirect, for example from food, consumer electronics, clothing and recreation (Capstick et al., 2015; Büchs and Schnepf, 2013; Druckman and Jackson, 2008).
| India: Average monthly expenditure by the richest 10% in 2012 | Total all deciles | Richest 10% | Poorest 10% | ||
|
Total expenditure
|
82,309 Rupees |
25,565 Rupees (31% of total) |
1,996 Rupees (2.4% of total) |
||
|
Fuel for private transport (Petrol, diesel, lubricants & other fuels for vehicles) |
2,656 Rupees |
1,261 Rupees (47% of total) |
1.6 Rupees (0.06% of total) |
||
|
Meat consumption (Meat, fish and eggs) |
2,558 Rupees |
505 Rupees (19% of total) |
67 Rupees (3% of total) |
||
Source: Household Expenditure for India by expenditure level 2011-2012, National Sample Survey Organisation; Analysis @ORF Datalabs (2015)
————————————————————————
Submit data on the ecological footprint of the richest people in India
The data you submit can be in any format e.g. statistics, visuals, symbolic examples. If the data you want to submit does not fit with the categories below contact us.
Leave a Reply